
So, recently I configured InfluxDB and Grafana in my Home Assistant setup (read more here how I have setup my Home Assistant environment). The setup was pretty much straight forward thanks to the good documentation out there, but when I tried to integrate the Grafana graphs using IFrame into Home Assistant and Lovelace, I almost instantly ran into problem.
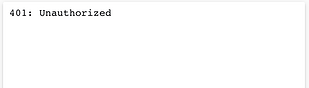
After some reading, I learned that Home Assistant is using a so called ingress mode to open and sign-in to third-party plugin’s web UI. This is also the case for Grafana. However, when integrating Grafana with Home Assistant and Lovelace using IFrame, the ingress is not working and you are receiving a “401: Unauthorized” error.
I started searching around the web and found multiple threads about users facing the same issue. For instance in this thread, this one, and this. It didn’t seem like anyone had a solid solution, so I tried solving it on my own using trial and error.
Before I give you the solution, let’s back it up a little.
Setup InfluxDB
As you may know, Grafana is a tool to visualize your data. To do this, Grafana need a data connection of some sort. In the Home Assistant case, Grafana is working best in cooperation with an InfluxDB database. Since Home Assistant is using a built-in SQLite database (or a MariaDB which you should migrate to to gain speed and reduce the risk of corruption), Home Assistant need to be configured to store its data in an InfluxDB database in addition (Home Assistant isn’t able to use InfluxDB as its primary database).
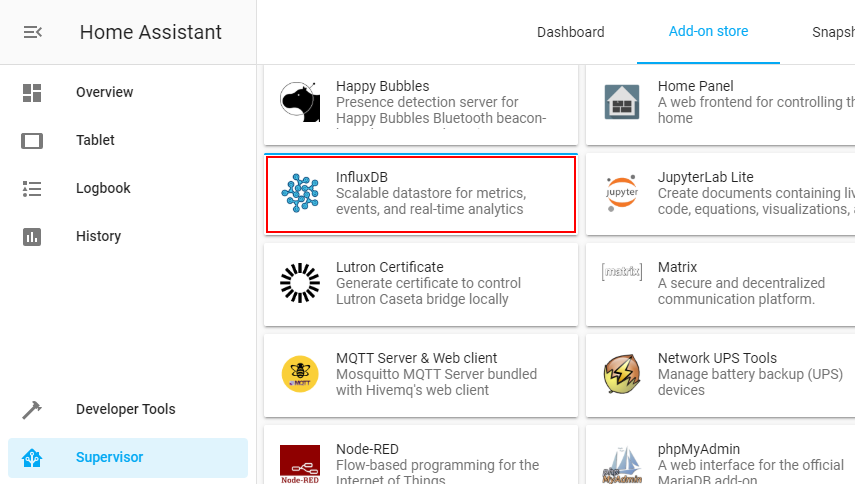
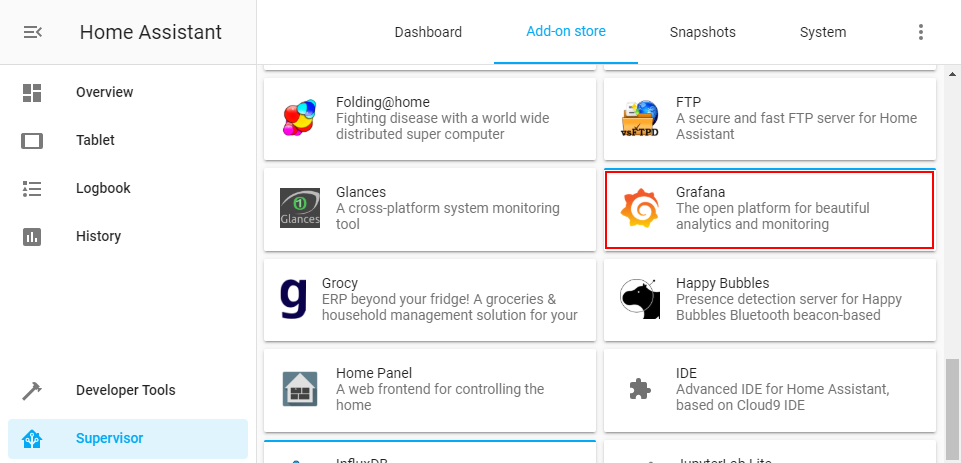
To achieve this, start off by install the InfluxDB add-on from the add-on store (if you’re using pure Home Assistant or Home Assistant Supervised).
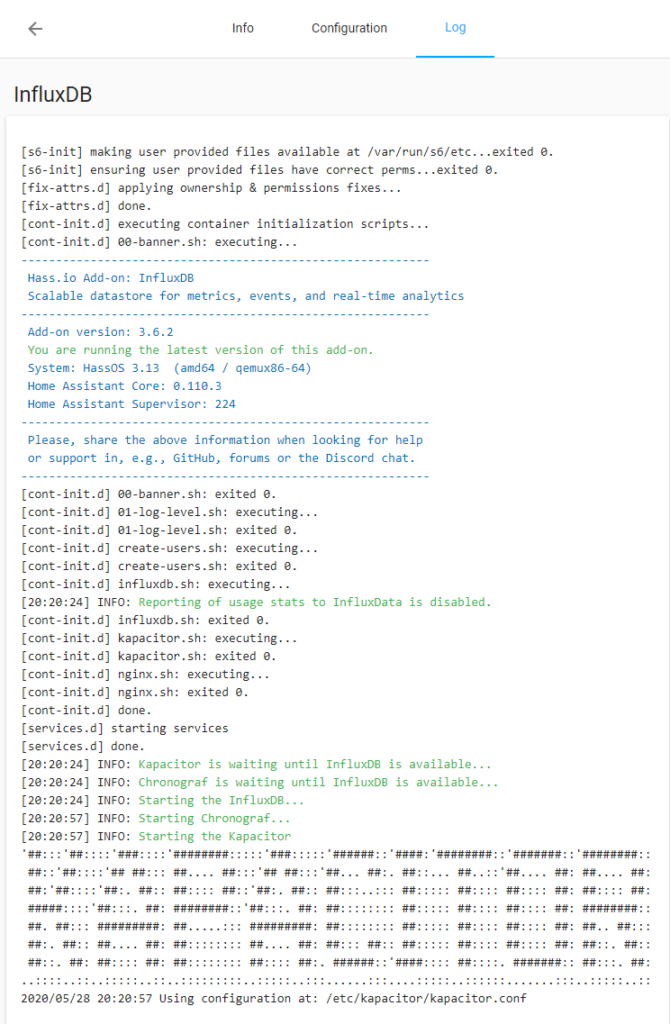
Once installed, you’re ready to start the database engine without any further configuration. Check the log file to see if everything went well.
The next step is to create a database, a user, and a password, from the add-on’s web UI. You also need to configure Home Assistant to use the database. Refer to the official documentation here.
Setup Grafana
Once Home Assistant has start storing data in the database, you’re ready to install and configure Grafana. Grafana can be installed in the same way as InfluxDB, if you’re having access to the add-on store.
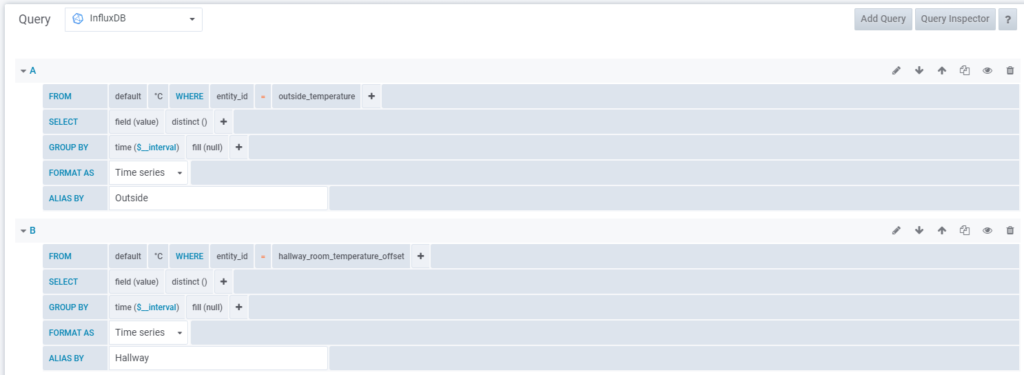
Start with configuring Grafana according to to the documentation. You can then continue to experiment with different graphs and visualization in the web UI.
IFrame
Now to the tricky part. To be able to use IFrame to show your graphs in Lovelace, you need to enable anonymous access (as the ingress sign-in method is not designed to work outside of the add-on’s web UI). For this, we need to take several parts into account.
- When enabling anonymous access, anyone can access your dashboards and graphs, as well as query any historical data from your Home Assistant installation. No one else can edit or create dashboards, change settings, etc. though.
- To access Grafana anonymously, you must publish it outside of the Home Assistant container and even publish it externally if you want to see the graphs in Lovelace when outside of your network.
- When publishing Grafana outside of Home Assistant, anyone can sign-in as admin with the default Grafana username and password. Hence, this must be changed.
Grafana Anonymous Access
To enable anonymous access in Grafana, the following changes must be done to the add-on’s configuration.
env_vars:
  - name: GF_AUTH_ANONYMOUS_ENABLED
    value: 'true'
If you’ve changed the organization name within Grafana, you must also alter the add-on’s configuration to match that name.
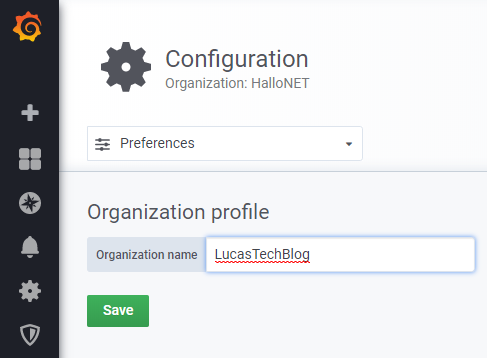
env_vars:
  - name: GF_AUTH_ANONYMOUS_ENABLED
    value: 'true'
  - name: GF_AUTH_ANONYMOUS_ORG_NAME
    value: LucasTechBlog
Publish Grafana
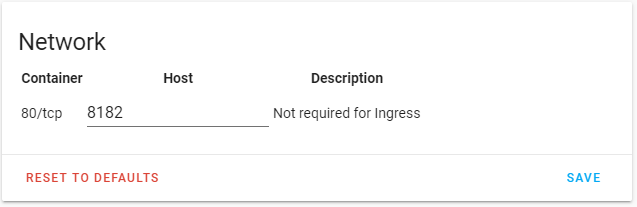
To be able to actually reach Grafana anonymously, you must publish it outside the Home Assistant container. To do so, simply enter a random port number in the add-on’s configuration and restart Grafana.
To be able to reach it outside of your network, you either need to configure a port forward in your router, or make some kind of reverse proxy (in my case, I have published it via a random DNS name through HAProxy using standard HTTPS on port 443 – read more about by HAProxy setup here).
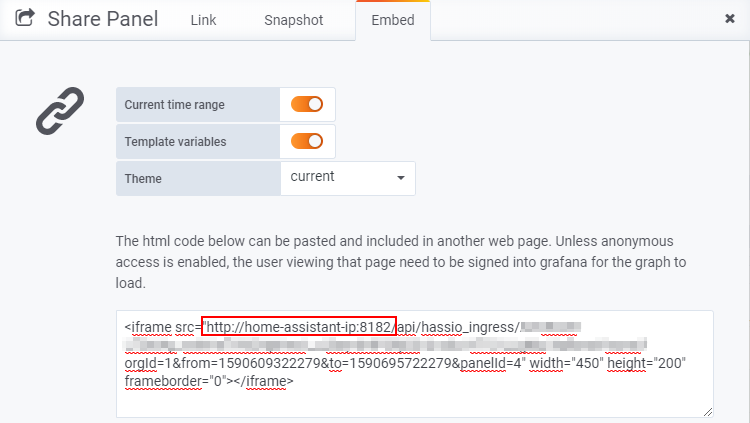
You should now be able to reach Grafana using http://home-assistant-ip:8182 and you’re ready to add your graphs in Lovelace using IFrame! Just make sure the IFrame URL points directly to your Grafana installation.
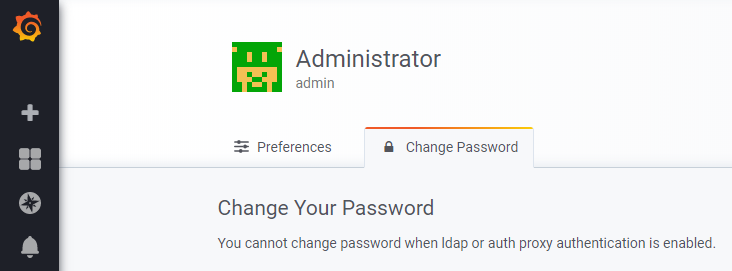
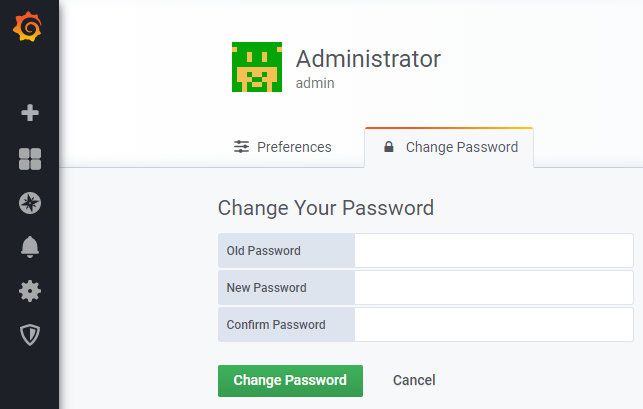
Change Grafana Default Password
Now to the most important step – changing the default password! According to the documentation, the password for the default user admin must be changed. The only problem is… you can’t. You will get an error like the one below.
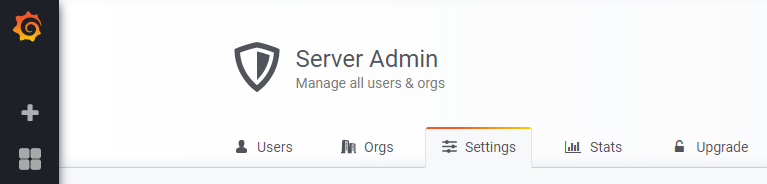
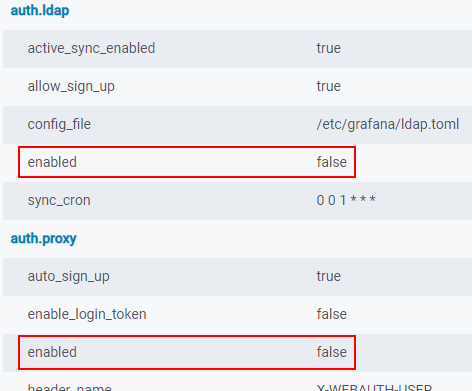
To solve this, you need to turn off both the LDAP and proxy authentication methods. To do so, the add-on’s configuration need to be changed once again.
env_vars:
  - name: GF_AUTH_ANONYMOUS_ENABLED
    value: 'true'
  - name: GF_AUTH_ANONYMOUS_ORG_NAME
    value: LucasTechBlog
  - name: GF_AUTH_LDAP_ENABLED
    value: 'false'
  - name: GF_AUTH_PROXY_ENABLED
    value: 'false'
As a result, both authentication methods will be disabled.
You may now go ahead and change the password. 🙂


This is a great guide, thank you! Took me some time to get the reverse proxy working for external access but it’s running smoothly for me now.
For login, I did not change the admin credentials. Instead, I disabled all options for external login/sign-up. My environment variables look like this:
– name: GF_AUTH_ANONYMOUS_ENABLED
value: ‘true’
– name: GF_AUTH_ANONYMOUS_ORG_NAME
value: Main Org.
– name: GF_AUTH_DISABLE_LOGIN_FORM
value: ‘true’
– name: GF_AUTH_ANONYMOUS_ORG_ROLE
value: Viewer
– name: GF_USERS_ALLOW_SIGN_UP
value: ‘false’
Thank you!
I spent so much time trying to get a wall display working and getting the 401 error!